Case Study · Shore Excursions Group
The channel everyone files under “awareness” became Shore Excursions Group’s best closer.
Most e-commerce brands treat organic social as the top of the funnel. We read the attribution differently. Over the past year, organic social revenue for Shore Excursions Group more than doubled, from $86K to $181K in Q4 alone, then reached $373K in Q1 2026. And it became the last touch on 78% of the conversions it influenced.




$181K
Shore Excursions Group

78%
Of conversions touched,
organic social was last

+75%
Last-touch conversions from organic social, Q4 YoY

CLIENT
Shore Excursions Group

Industry
E-commerce · Cruise & Travel

Engagement
Social Media Management (Organic Social)

Offering this proves
Social Media Management (Organic Social)
01
THE STUCK POINT
A Channel Doing The Work, Getting None Of The Credit.
Shore Excursions Group sells cruise shore excursions online. It is a high-consideration purchase. A family books months ahead, compares operators, reads reviews, and weighs the cost against a once-a-year vacation. The data shows the average buyer touches organic social eight times before they book.
That kind of purchase punishes last-click thinking. Whatever channel happens to be last in the path takes the credit, and for years that credit went to search and email. Organic social got filed under awareness: good for reach, not counted toward revenue.
Then the channels that were supposed to close started slipping. In Q4 2025, Shore Excursions Group’s overall website revenue and conversion rates were falling, heading straight into peak booking season.
The diagnosis: the problem was not that organic social wasn’t working. The problem was that nobody was measuring the part of the job it was actually doing.
8
Avg. touches before booking
Last Click Only
How it was measured
Revenue Falling
Q4 2025 signal
02
THE BET
Run organic social as a revenue
channel. Then prove it.
The easy move would have been to chase the dip with more paid spend. We made a different call: stop reporting organic social as a reach channel, and start running it, and measuring it, as a revenue channel. The bet had two parts: build content for booking intent, and prove dollar value by reading GA4 the way the buyer actually behaves.
Content That Books. Attribution That Proves. Community That
Retains.
3 platforms. 1 unified calendar loop.


Content For Booking Intent
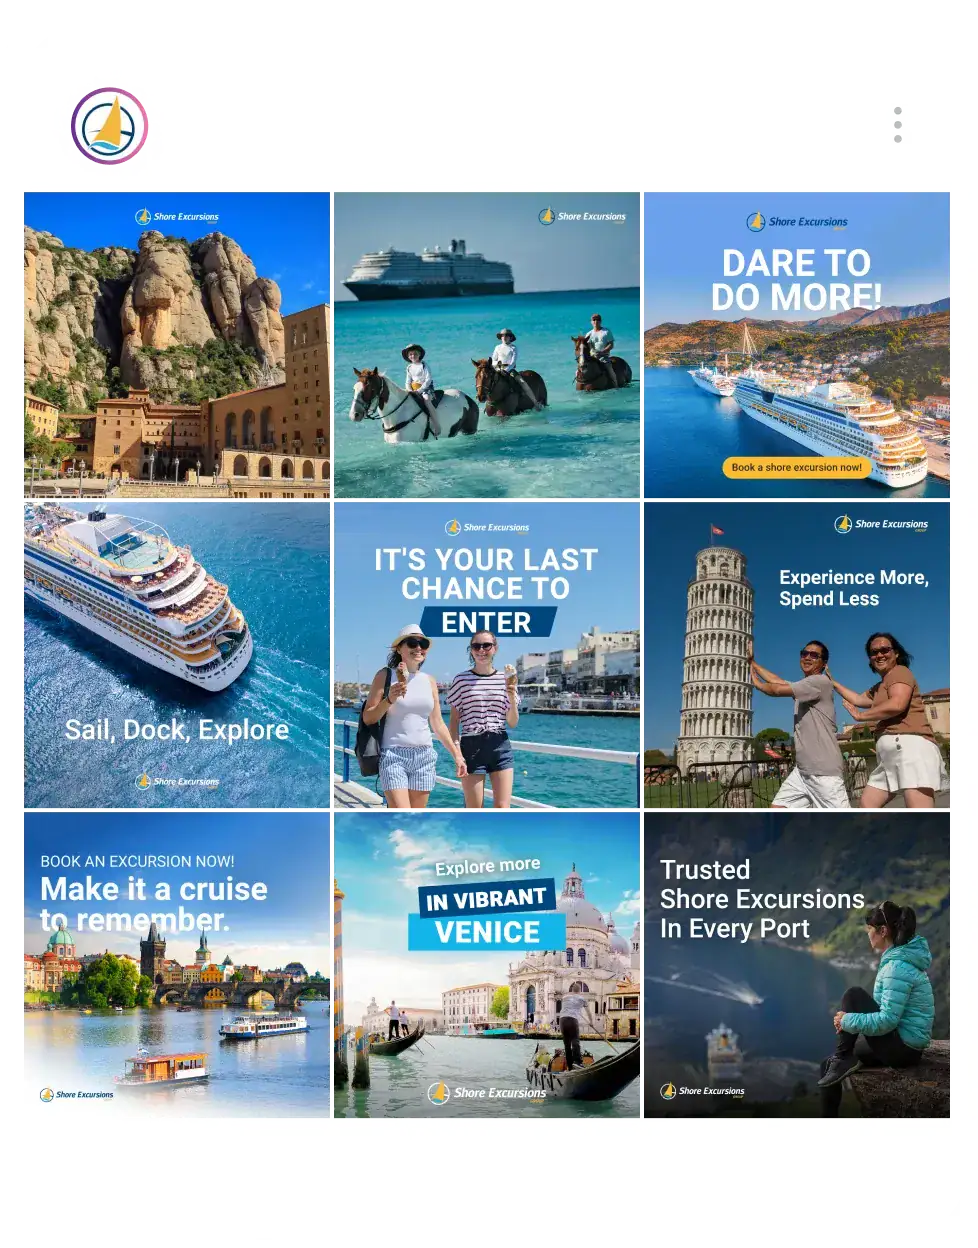
Destination-led, experience-first creative aimed at the moment a family is deciding where to spend a shore day, not generic promotional graphics

GA4 Attribution Reframe Production
Counting both last-touch and assisted conversions instead of the last click alone, the only number that answers whether social made the client money

Community As Retention
Running community as a booking surface, not an afterthought, turning past travelers into a content engine for future cruisers
3 platforms. 1 unified calendar loop.
03
THE WORK
Three tracks: content that
books, community that retains,
attribution that proves.
Generic promotional graphics underperformed, we cut them. The traveler photo contest pulled 216 entries, the highest-entry giveaway in the program to date. Every quarterly readout traced organic social through GA4 on both last-touch and assisted conversions, so the channel’s revenue was on the table in dollars every time the budget conversation came up.
Content Built To Close
Destination-driven and experience-focused. Generic promotional graphics underperformed, so we
cut them. Each platform got a defined role, Facebook as the conversion engine, Instagram for
aspirational reach, TikTok approved for a full slate of new concepts.
Intent-first · not impressions-first

Community As Retention

Attribution As A Discipline

“
Boosted post campaign is going well so far this month. Greatly appreciate the focus and attention to detail on it.

Jeff
Shore Excursions Group
ROAS
2.82×
Dec CPC
$0.22
Link clicks
+1,681%

04
THE INFLECTION
Q4 2025: the quarter the attribution flipped.
Q4 2025 is when the role reversed. Organic social revenue more than doubled year over year, while the rest of the site was sliding. The dollar figure mattered. What it pointed to mattered more: organic social was the last touch on 78% of the conversions it was part of, up from 69% the year before.
That was the quarter organic social stopped being the channel that introduced the excursion and became the channel that booked it. The reporting finally caught up to what the content was already doing.
$86K

$181K
Q4 2024 → Q4 2025 · organic social revenue
+109% year over year, while overall site revenue and conversion rates were falling heading into peak booking season.
Last-touch conversions jumped 75%. The last-touch share of all conversions organic social touched climbed from 69% → 78%.
It didn’t stop there. Q1 2026 brought $373K in organic social revenue, 581 conversions. When Q1 2026 softened sitewide by 13%, organic social fell only 5%. A channel that holds when everything else drops is not an awareness channel. It is infrastructure.
05
THE PROOF
Organic social, counted in dollars.
Source: Shore Excursions Group GA4, organic social, last-touch and assisted conversions. Reporting window: Q4 2025 and Q1 2026, measured year over year.
Organic Social Revenue – Q4 2025 & Q1 2026
Metric
Vs. Prior Cycle
Result
Details
$
Metric
Organic Social Revenue · Q4 2025
$181K
Vs. Prior Cycle
+109% YoY
Result
Last-touch + assisted · from $86K Q4 2024 · while overall site revenue was falling
Details
$
Metric
Organic Social Revenue · Q1 2026
$373K
Vs. Prior Cycle
581 conversions
Result
Last-touch + assisted · the channel’s highest credited quarter
Details
C
Metric
Last-Touch Conversions · Q4 2025 YoY
78%
Vs. Prior Cycle
from 69%
Result
Of the conversions organic social touched, it was the closing channel, not just the intro
Details
%
Metric
Last-Touch Share · Q4 2025
+75%
Vs. Prior Cycle
YoY Q4
Result
Organic social closing more sales, not just appearing earlier in the path
Details
R
Metric
Q1 2026 vs. Site Performance
−5%
Vs. Prior Cycle
vs. −13% sitewide
Result
Organic social held when everything else dropped, revenue per conversion grew, not shrank
Details
I
Metric
Follower Growth vs. KPI · Q1 2026
267%
Vs. Prior Cycle
of KPI
Result
Across Facebook, Instagram, and TikTok, audience growing as the revenue channel strengthened
Details
05.5 · The Amplifier – Putting Money Behind The Proven Organic Winners
Metric
Result
vs. Prior
Details
R
Metric
ROAS · April 2026 Boosting
2.82×
Result
$7,994 revenue
vs. Prior
On $2,830 spend · evergreen proven posts boosted, not new creative
Details
C
Metric
Cost Per Link Click · April 2026
$0.12
Result
Per click
vs. Prior
Boosting posts that had already earned their reach organically
Details
D
Metric
December CPC YoY
$0.22
Result
from $3.81
vs. Prior
Evergreen model vs. prior December’s collapsed $3.81 CPC · 0.31% CTR
Details
L
Metric
December Link Clicks YoY
+1,681%
Result
YoY December
vs. Prior
The evergreen boosting model vs. chasing whatever was newest
Details
06
THE UNLOCK
What proving the channel actually unlocks.
Proving organic social as a revenue channel changes the conversation. Budget stops being a fight between “brand” and “performance,” because the brand channel is now a performance channel. Paid amplifies what organic already validated.
New formats get a real hearing: Shore Excursions Group greenlit the full slate of TikTok concepts and handed the team open range, because the organic engine had earned the trust. That is what three years of receipts looks like, five million excursions booked, a photo contest that pulled its highest entry count ever, and a channel the client now counts in dollars.
For a high-consideration purchase, organic social is not the top of the funnel. It is the channel that closes the sale. Most brands just never measure it that way.
For a high-consideration purchase, organic social is not the top of the funnel. It is the channel that closes the sale. Most brands just never measure it that way.
$373K
Organic social revenue · Q1 2026
581 conversions
78%
Last-touch share of conversions influenced
from 69%
2.82×
ROAS · boosted evergreen posts
$0.12 CPC
5M
Excursions booked · partnership milestone
3-year partnership
216
Traveler photo contest entries
Program record

If your organic social is filed Under “awareness”,
you’re undercounting what it earns.
Sociallyin’s social media management runs strategy, content, community and reporting as one connected operation. Send us your last 90 days and we’ll tell you exactly what’s broken and what would move first.
Ready to Maximize Your Social Media
Potential?
We’d love to hear about your organization’s goals on social media. Get in touch with us today!